Hybrid Overbought/Oversold Detector + Put/Call SignalsThere are many indicators of overbought/oversold conditions out there. Some of more common ones are:
- Bollinger Bands %B
- Money Flow Index (MFI)
- Relative Strength Index (RSI)
- Stochastic
This script uses a combination of these 4 oscillators to confirm overbought/oversold and filter the signals of market reverse which could be used for trading binary options.
You may select which oscillators you want to apply and of course change the source, the length of the calculations and the overbought/oversold levels.
Also the script will draw a combined graph which is the average of the selected oscillators in the options.
Send me your ideas!
In den Scripts nach "binary option" suchen

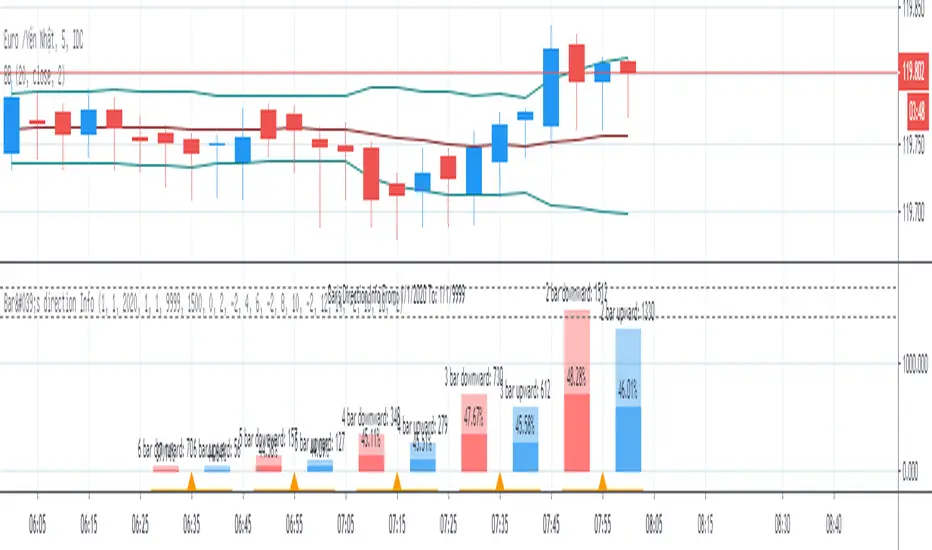
Bar's direction InfoBar's direction Info show number of case which bars have same direction and counting percent of next bar's direction.
This info may be useful to trade Binary Option.

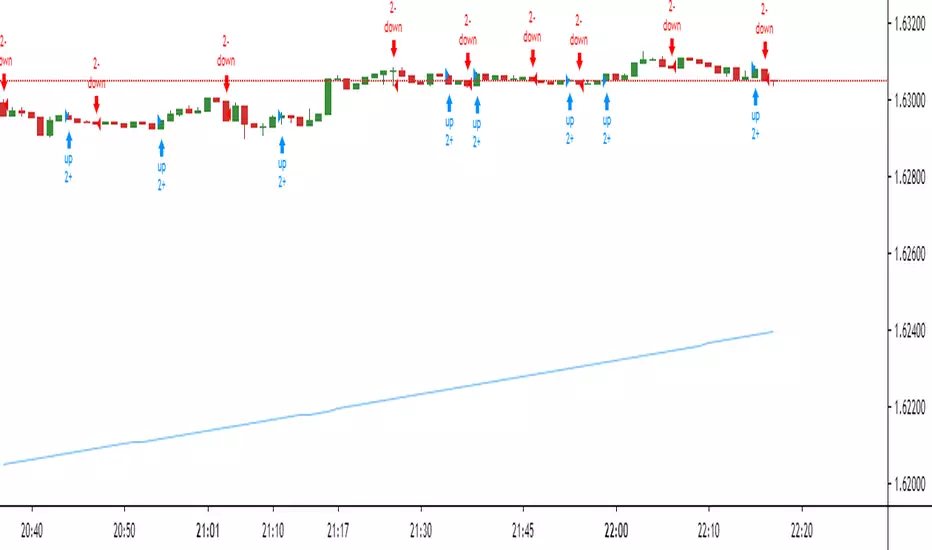

Arrows Perfect BinaryThis is a binary options script for detecting the best flaws in the market and taking advantage.
Initially, the script was coded with Martingale in mind and no losses occur in 3-5 cycles but a revision was made and this is the current version 1.0 of the script. Use this script wisely, It's a powerful one and might be the Holy Grail or Account Blower.
If you think of something please lemme know so that I can improve the value of this script to the community.
I am open to wise contributions.
Enjoy, lucemanb

Momentum Strategy, rev.2This is a revised version of the Momentum strategy listed in the built-ins.
For more information check out this resource:
www.forexstrategiesresources.com

Profit Maximizer 90%-95% IntraDayTrade Strategy WithTester Developed for Intraday and for very very Lesser Time Frame Trading. Note: Invite only Script .Request to me Access permission to test this.
Strategy tester enabled .All you can test this in live market in any segment.
Lesser the time frame greater the success rates as the test results.
This can be used : Crypto Currency/Bitcoins ,Forex,currencies ,Index ,Commodity Gold/silver ,Oil Market and in Equity /Futures
It will work for BINARY OPTION ,BINARY DIGITAL to enter and hold the position in right direction, User test it and confirm .
How to Use:
Three Main Zone BackGrounds: 1. Green Zone 2. LightRed Zone 3. Yellow Zone
1.Long only when Bar Color changed from Red or Black to BLUE and BackGround in Green, Hold the position until opposite color comes.
2.Short when BAR become Black and BackGround Red Exit when opposite color come.
3.Yellow Back Ground : Risk Trade Zone : When Red BARs Cautious Short , Yellow Zone LightGreen Bars (Avoid Trade) .In Yellow Zone Close the previous Entered postions.
Time Frame : Lesser Time Frame and holding for longer time will give Good Result . 1min-1Hrs . This will not work >1Hr Strategy and Candle will disappear >1hr TimeFrame.
Strategy Tester : Choose any Date Month Year to Current Date and check the results below in the Strategy Tester.
REPAINT/NO REPAINT : No Repaint ,Previous candles and Background Color wont change. In the current candle position wait for the candle to close to see the stability.Current candle color might oscillate bit However it will not change from Blue to Black or Black to Blue or Black to Red.
Note : Last Bar will be a actual Green or Red Bar by Default Do not Confuse with this.It is trading view default strategy design working way.Once Bar closes actual strategy color will appear.
ALERT /AUTOVIEW capabilities : Strategy Tester does not support ALERT by default as you all know.In the Indicator version Alert will be added for all Buy Sell and cover entries.
Test the strategy.
SCRIPT : Access must be given by me to test this .Once access given you can test ,Request for access .Without access Study Not Auth error will come.
Review and Feedback.Thank you!
Refer the Release notes for any updates and my posts below and in my idea page for more details. Thank you!
Any issues report to me to Fix.Thank you!

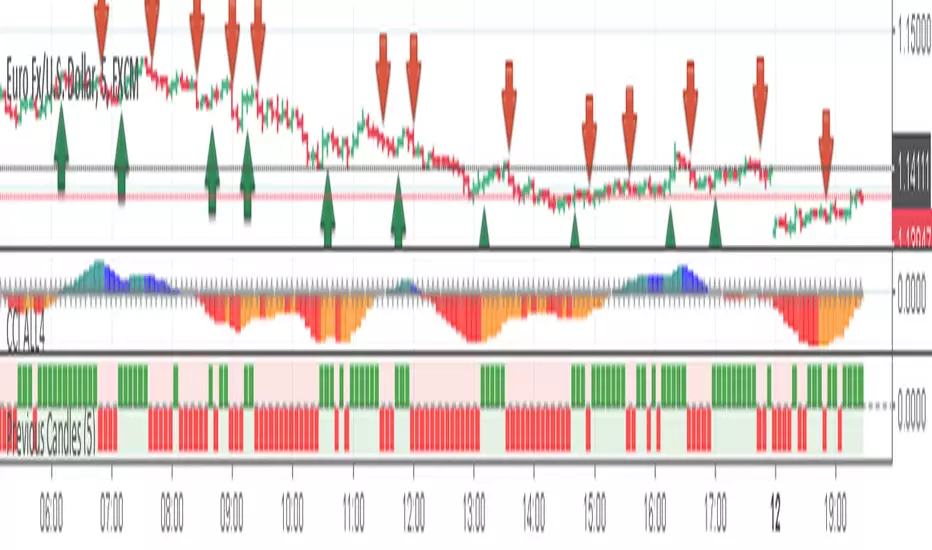
Previous CandlesThis is an indicator based on the average of the maximum and minimum of the past candle, and there is another strategy that makes the filter, it is very good for binary options, if you combine our indicator CCI and All4 it gets even better!
Currency: Any pair.
TimeFrame: 5m
Execute order: You can enter 1 minute or 5 minutes.
In the graph below the ICC, you can see the green and red squares, it works as follows.
Before giving any input you have to enter the change of a color.
Example: It was red and now it's green, so you could give the entry, but you must have at least 3 squares of red before, if only 1 squared has appeared, the hit percentage will be low!
The CCI indicator is for confirmation.
Any doubt I am available!
Note: This indicator does not make magic nor is it a holy grall, it is only an indicator to aid in binary operations!

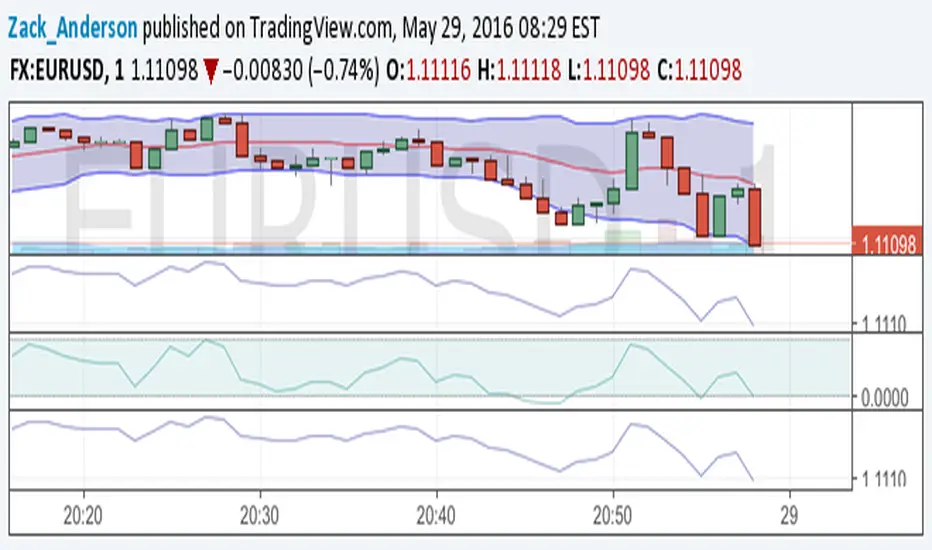
Binary /Fx Fibonacci Bollinger BandsBinary /Fx Fibonacci Bollinger Bands
Very Strong, Powerful Indicator that is great for Binary Options and Forex traders.
This System is fantastic allowing my students to achieve quick easy profits with minimal effort. I have been working on this kind of system for over 3 years and now think that it's time to spread the work a little and help others.
This System uses the same effect as the famous Bollinger Bands but also incorporates Fibonacci into it too. I found that this creates an extremely accurate entry and exit points. After years of testing, I have found nothing like it.
Plus its really easy to use! :
First, do not take any trades until the candles hit either the top or bottom band.
Then, depending on which band is hit will then determine the direction you take a trade.
If the candlesticks hit the Red Line Sell/Put.
If the candlesticks hit the Green Line Buy/Call.
An effective money management system is required in order to increase your success rate.
That is all, please let me know if you are interested in testing the system and if you have any questions, also, please share.
I hope to hear how you get on with my system and wish you all the best.
Thanks :)

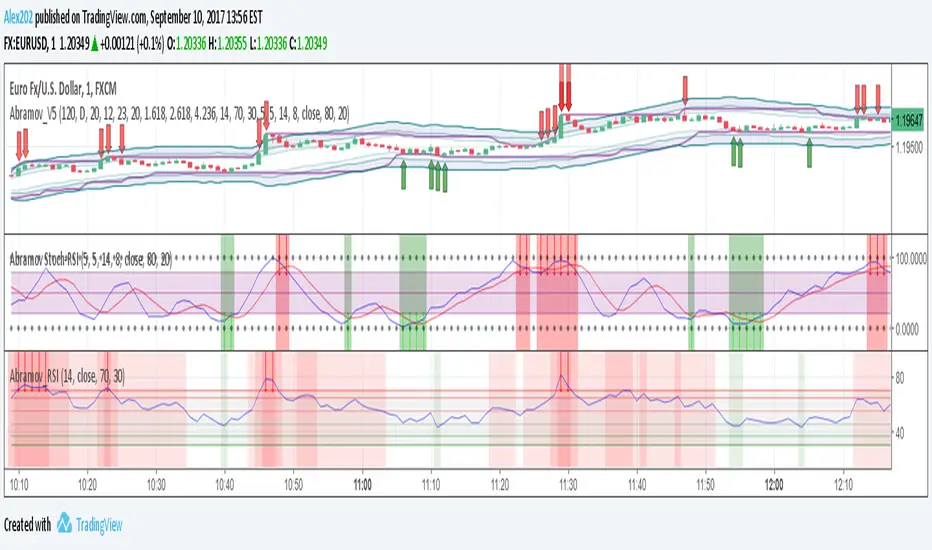
Abramov_V5Improved script Abramov_V4, has notifications
Recommended for binary options
Strategy is on my site
Multicurrency
Timeframe from 1 minute
Volatility - not lower than average
This indicator includes:
1. Bollinger waves 3 levels - incl. / off.
2. Moving averages 2 pieces - incl. / off.
3. Price channel - incl. / off.
4. Support and resistance level per day - incl. / off.
5. Support and resistance level for 120 minutes - incl. / off.
6. Arrows RSI + Stochastic buy / sell
7. Arrows to buy / sell on the price level in the channel
8. Customizable notifications from the indicator, now you do not need to waste time searching for a good entry point, notification comes in advance.
9. The indicator does not redraw!
Any of the indicators is configurable.
The optimal settings are set by default.
This indicator is suitable for several strategies.
Paid subscription to the indicator
When working with this indicator, it is necessary to avoid news and sudden jumps in the market
For additional signal filtering, I recommend:
Abramov_RSI - additional indicator
Abramov Stochastic-RSI - additional indicator
----------------------------------------------
Улучшенный скрипт Abramov_V4, имеет оповещения
Рекомендовано для бинарных опционов
Стратегия у меня на сайте
Мультивалютный
Таймфрейм от 1 минуты
Волатильность - не ниже среднего
Этот индикатор включает в себя:
1. Волны Боллинджера 3 уровня - вкл. / выкл.
2. Скользящие средние 2 штуки - вкл. / выкл.
3. Канал цены - вкл. / выкл.
4. Уровень поддержки и сопротивления за день - вкл. / выкл.
5. Уровень поддержки и сопротивления за 120 минут - вкл. / выкл.
6. Стрелки RSI+стохастик купить/продать
7. Стрелки купить/продать по уровню цены в канале
8. Настраиваемые уведомления от индикатора, теперь не нужно тратить время на поиски хорошей точки входа, уведомление приходит заранее.
9. Индикатор не перерисовывает!
Любой из индикаторов настраивается.
Оптимальные настройки устанавливаются по умолчанию.
Этот индикатор подходит для нескольких стратегий.
Платная подписка на индикатор
При работе с этим индикатором необходимо избегать новостей и резких скачков на рынке
Для дополнительной фильтрации сигналов рекомендую:
Abramov_RSI -дополнительный индикатор
Abramov Stochastic-RSI -дополнительный индикатор
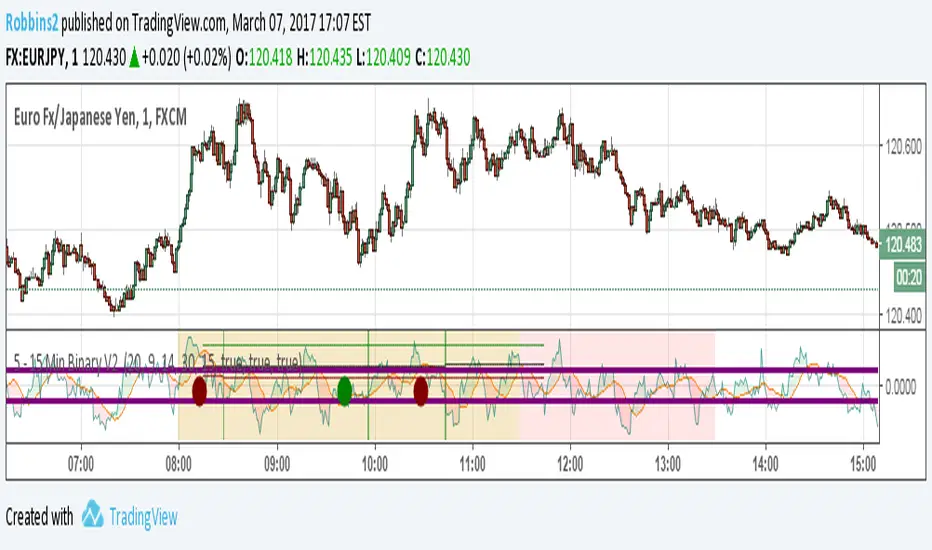
5 - 15 Min Binary V2 Hey guys
As promised back with the updated indicator without needing my blessing to use. Please post feedback so that I can perfect it.
Works great on EU/JP and USDCAD with a risk factor of 20 – 25. Use 1 time frame with 15 mins Expiry for nest results. Possible to get 90% ITM with this setup.
Updated Feature
Risk Factor: Higher the number lowers the risk but also means lower trade setups. Best between 20 – 25.
Added an additional Filter to minimize bad setups
No trading between 11.30 EST to 13.00 EST. Not worth the risk.
Displays ITM rate in Green, Red and total in Black.
Alert capable for Both, Call or Put
Please demo before you take it live. Also during normal trading hours I have not seen more than 3 consecutive loses, (unless there is a news release) so with money management you can greatly increase your total ITM rate.
If you like this indicator, feel free to donate some BTC at 18qrzku9LrQuMq9LyRYmiTbqUtC2bSAv3y
It does take considerable amount of tweaking and testing to put out something like this.
Post feedback so that everyone can benefit.
MM-Burj Khalifa IndicatorThis indicator uses several signals to visualize a "perfect candle" to enter a trade.
It colors the background to identify the zones of interest (multiple configurable high or low RSI zones). Underlying is a trendbar with the current MACD direction.
The indicator is using signals of:
--MACD
--RSI
--PVT
--ATR
--AD and DMI+/DMI-
When all 7 criterias are met it highlights the candle.
It also creates different colums with different height and width, so that you can see which signal is OK and which is maybe missing. When all signals are on GO you'll see a Burj-Khalifa-like figure. If not all signals are on GO you'see crippled versions.
To be clear:
it's not intended to detect trends or supertrends or reversals. It's purpose it's just to decide if this current candle is really going in the right direction.
The Burj-Khalifa indicator could help to confirm the entry point of an trade which was already planned.

Bollinger Bands NEW
var tradingview_embed_options = {};
tradingview_embed_options.width = 640;
tradingview_embed_options.height = 400;
tradingview_embed_options.chart = 's48QJlfi';
new TradingView.chart(tradingview_embed_options);
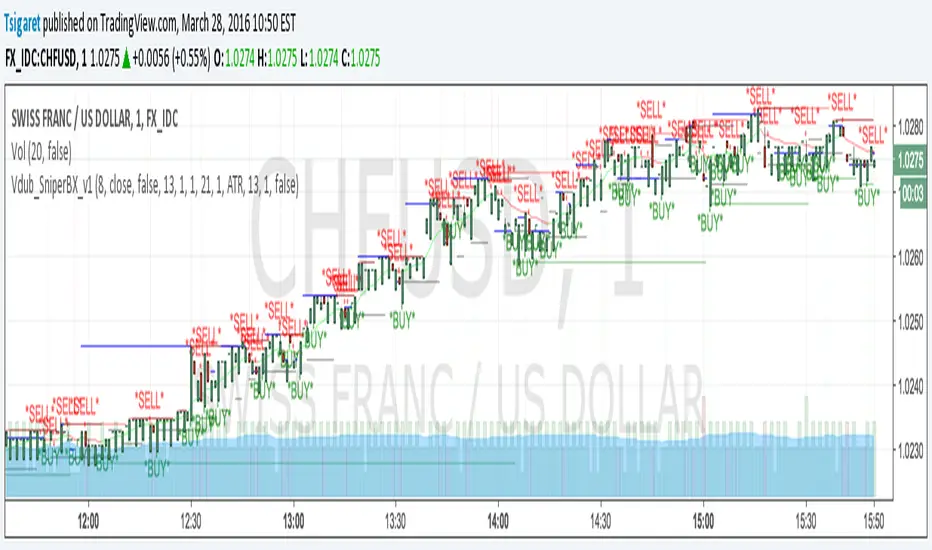
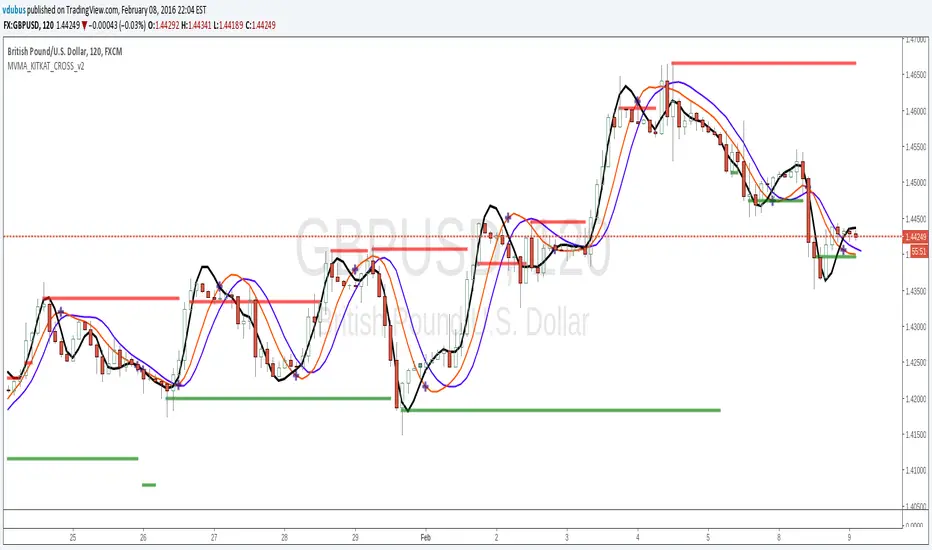
Vdub Binary Options SniperVX v1 by vdubus on TradingView.com
Momentum VMA KITKAT CROSS v2*Update Momentum VMA KITKAT CROSS v2
triple MVMA (Hull MA) with integrated Kitkat
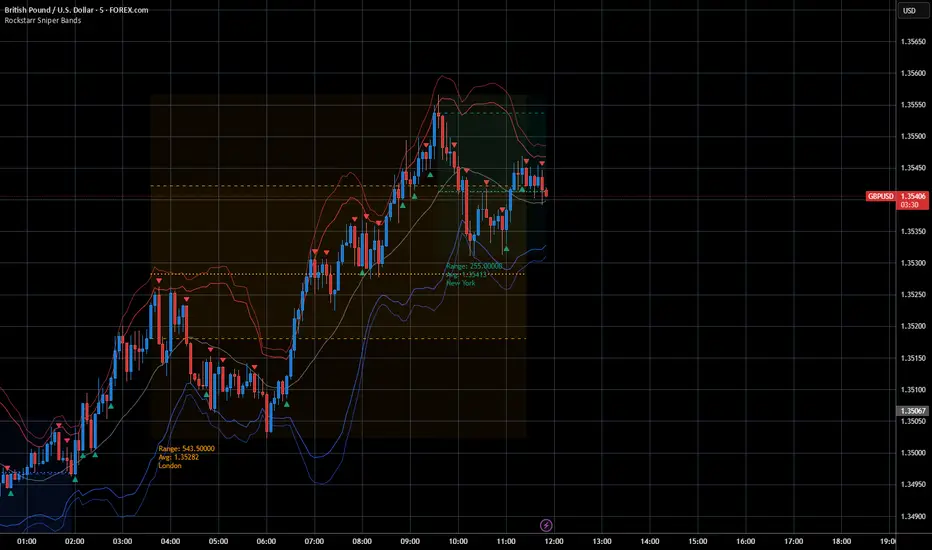
Session Sniper Bands — Pro Overlay (Bollinger, Sessions, Engulf)The Session Sniper Bands — Pro Overlay combines three powerful tools into one clean, professional script designed to help traders spot high-probability setups across any market.
📌 What’s included:
Dual Bollinger Bands → track volatility squeezes, expansions, and mean reversion zones.
Customizable Trading Sessions (Tokyo / London / New York) → shaded regions with editable names, open/close lines, range, and average price markers.
Engulfing Candlestick Signals → automatic bullish and bearish engulfing arrows for precision entry timing.
✨ Features:
Session names and times are fully customizable (rename “Tokyo” to “Asia Open,” etc.).
Clear OB/OS volatility cues via Bollinger stack.
Lightweight visuals that won’t clutter your chart.
Works across Forex, Crypto, Indices, and Binary Options.
⚡ Why use it?
This overlay is built for traders who want to snipe entries with session context. Spot when volatility contracts, align with session flows, and confirm with engulfing momentum candles — all in one view.
⚠️ Disclaimer: This script is for educational purposes only and is not financial advice. Always test on demo before trading live.
BTC/USD sainBTC/USD 30s Trend-Following Alert v2
Description
This script is designed for short-term trading on BTC/USD, especially for 30-second entries.
It combines EMA (trend direction) and RSI (momentum filter) to generate trend-following buy/sell alerts.
• Core logic
1. EMA (Exponential Moving Average) identifies the main market direction.
2. RSI (Relative Strength Index) checks overbought/oversold conditions within the short-term trend.
3. A signal appears only when both conditions align with the trend, filtering out weak entries.
• Entry conditions
・High (BUY): Price closes above EMA and RSI is above the high threshold → bullish continuation.
・Low (SELL): Price closes below EMA and RSI is below the low threshold → bearish continuation.
• Features
・Simple but effective trend-following method for very short timeframes.
・Customizable parameters: EMA length, RSI length, RSI thresholds.
・Clear chart labels (“HIGH” / “LOW”) with real-time alerts for automated or manual trading decisions.
• Usage
Apply on lower timeframes (e.g., 30s–1m) to catch quick trend continuations.
Signals can be used for scalping or binary options style entries.
• Disclaimer
This script does not guarantee profits. Always manage risk and combine with price action or additional confirmation tools.
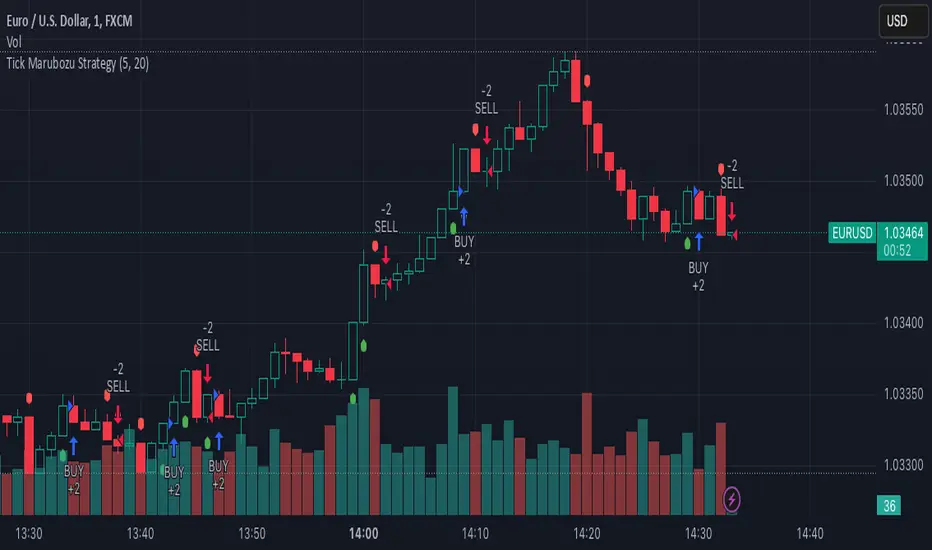
Tick Marubozu StrategyStrategy Concept:
This strategy identifies Marubozu candles on a tick chart (customizable pip size) with high volume to signal strong market momentum.
Bearish Marubozu → Strong selling pressure → Enter a SELL trade
Bullish Marubozu → Strong buying pressure → Enter a BUY trade
Entry Conditions:
Marubozu Definition:
Open price ≈ High for a bearish Marubozu (minimal wick at the top).
Open price ≈ Low for a bullish Marubozu (minimal wick at the bottom).
Customizable body size (in pips).
High Volume Confirmation:
The volume of the Marubozu candle must be above the moving average of volume (e.g., 20-period SMA).
Trade Direction:
Bearish Marubozu with High Volume → SELL
Bullish Marubozu with High Volume → BUY
Exit Conditions:
Time-Based Expiry: Since it's for binary options, the trade duration is pre-defined (e.g., 1-minute expiry).
Reversal Candle: If a strong opposite Marubozu appears, it may indicate a trend shift.
M & W Checklistindicator to Validate & Grade M & W Patterns.
Indicator Inputs
Table Color Palette
• Position Valid : Positions the Valid Trade table on the chart.
• Position Grade : Positions the Grade table on the chart, hover over the Column 1 Row 1 for a description of the bands.
• Size: Text size for all tables.
• Text Color : Sets text color.
• Border Color : Sets the table border color for all tables.
• Background Color : Sets table backgroud color for all tables.
Valid Trade Table
Checkboxes to indicate if the trade is valid. Fail is displayed if unchecked, Pass if checked.
Grade Table
• S/R Level 1: distance between neckline and 1st resistance area in % of the total distance between neckline and take profit. This is not for road blocks but pivot points etc before the initial run up/down in price. I have this set to 30% , this means that if there is a pivot point between the neckline and 30% of the TP level I weight it negatively.
• S/R Level 2: distance between neckline and 1st resistance area in % of the total distance between neckline and take profit. This is not for road blocks but pivot points etc before the initial run up/down in price. I have this set to 50% , this means that if there is a pivot point between the neckline and 50% of the TP level 2 weight it negatively but less so than level 1.
• S/R Level 3: distance between neckline and 1st resistance area in % of the total distance between neckline and take profit. This is not for road blocks but pivot points etc before the initial run up/down in price. I have this set to 70% , this means that if there is a pivot point between the neckline and 70% of the TP level 3 weight it negatively but less so than level 1 & level 2.
• Checkboxes are self explanatory, they are binary options, all are weighted negatively if checked and are weighted positively if unchecked. Divergence values for weighting are neutral if unckecked & weighted positively if checked.
• The select options are neutral weighting if set to neutral , if set to For its weighted positive and set to Against weighted negatively.
Technical Specification of the Scoring and Band System
Overview
The scoring system is designed to evaluate a set of technical trade conditions, assigning weights to various criteria that influence the quality of the trade. The system calculates a total score based on both positive and negative conditions. Based on the final score, the system assigns a grade or band (A, B, or C) for positive scores, and a "Negative" label for negative scores.
Scoring System
The system calculates the score by evaluating a set of 12 conditions (gradeCondition1 to gradeCondition12). These conditions are manually input by the user via checkboxes or dropdowns in a technical indicator (written in Pine Script for TradingView). The score weights vary according to the relative importance of each condition.
Condition Breakdown and Weighting:
1. Divergences (GradeCondition1 & GradeCondition2):
◦ 1H Divergence: +5 points if condition is true.
◦ 4H Divergence: +10 points if condition is true (stronger weight than 1H).
2. Support/Resistance at Neckline (GradeCondition3):
◦ Negative if present: -15 points if true (carries significant negative weight).
3. RB near Entry (GradeCondition4):
◦ Very Negative: -20 points if true (this is a critical negative condition).
4. RB can Manage (GradeCondition5):
◦ Slightly Negative: -5 points if true.
5. Institutional Value Zones (GradeCondition6 to GradeCondition8):
◦ For the trade: +5 points.
◦ Against the trade: -5 points.
◦ Neutral: 0 points.
6. S/R between Neckline & Targets (GradeCondition9 to GradeCondition11):
◦ Level 1: -10 points if true, +7 points if false.
◦ Level 2: -7 points if true, +7 points if false.
◦ Level 3: -5 points if true, +7 points if false.
◦ Use fib tool or Gann Box to measure any S/R levels setup according to your preferences.
7. News Timing (GradeCondition12):
◦ News within 3 hours: -20 points if true (strong negative factor).
◦ No upcoming news: +10 points if false.
Scoring Calculation Formula:
totalScore = score1 + score2 + score3 + score4 + score5 + score6 + score7 + score8 + score9 + score10 + score11 + score12
Where:
• score1 to score12 represent the points derived from the conditions described above.
Coloring and Visual Feedback:
• Positive Scores: Displayed in green.
• Negative Scores: Displayed in red.
Band System
The Band System classifies the total score into different grades, depending on the final value of totalScore. This classification provides an intuitive ranking for trades, helping users quickly assess trade quality.
Band Classification:
• Band A: If the totalScore is 41 or more.
◦ Represents a highly favorable trade setup.
• Band B: If the totalScore is between 21 and 40.
◦ Represents a favorable trade setup with good potential.
• Band C: If the totalScore is between 1 and 20.
◦ Represents a trade setup that is acceptable but may have risks.
• Negative: If the totalScore is 0 or less.
◦ Represents a poor trade setup with significant risks or unfavorable conditions.
Band Calculation Logic (in Pine Script):
var string grade = ""
if (totalScore >= 41)
grade := "Band A"
else if (totalScore >= 21)
grade := "Band B"
else if (totalScore >= 1)
grade := "Band C"
else
grade := "Negative"
Technical Key Points:
• Highly Negative Conditions:
◦ The system penalizes certain conditions more heavily, especially those that suggest significant risks (e.g., News in less than 3 hours, RB near Entry).
• Positive Trade Conditions:
◦ Divergences, Institutional Value Zones in favor of the trade, and lack of significant nearby resistance all contribute positively to the score.
• Flexible System:
◦ The system can be adapted or fine-tuned by adjusting the weights of individual conditions according to trading preferences.
Use Case Example:
• If a trade has 1H and 4H Divergence, RB near Entry (negative), and no upcoming news:
◦ 1H Divergence: +5 points.
◦ 4H Divergence: +10 points.
◦ RB near Entry: -20 points.
◦ No news: +10 points.
◦ Total Score: 5 + 10 - 20 + 10 = 5 → Band C.
This modular and flexible scoring system allows traders to systematically evaluate trades and quickly gauge the trade's potential based on technical indicators
Summary:
Maximum Score: 61
Minimum Score: -97
These are the bounds of the score range based on the current logic of the script.

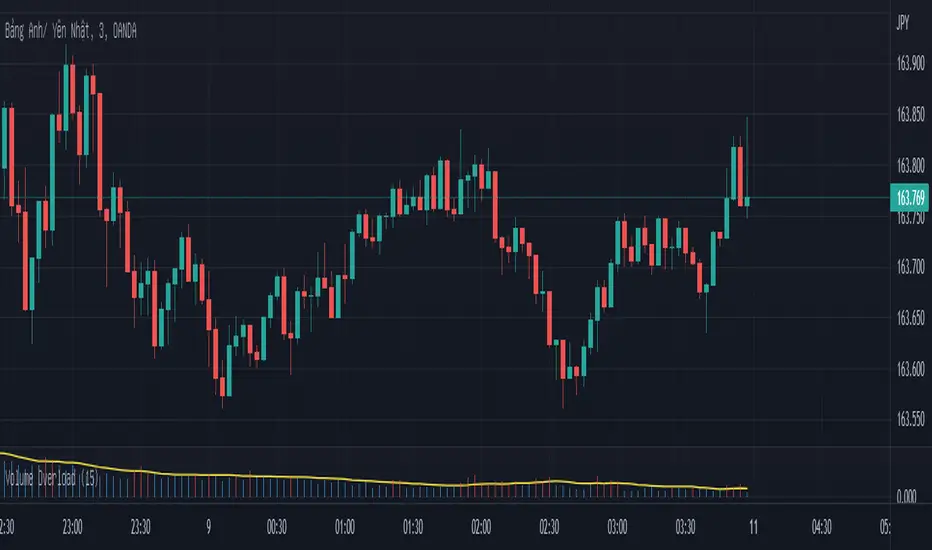
Overloaded Volume-Canddle v1This indicator will detect the candle has volume "too strong" base on "n" previous candle.
The Yellow Line is avg volume base n candle previous.
The Red line show over power volume of canlde.
Important : This indicator can use for forex, but i recommend it for binary options only.
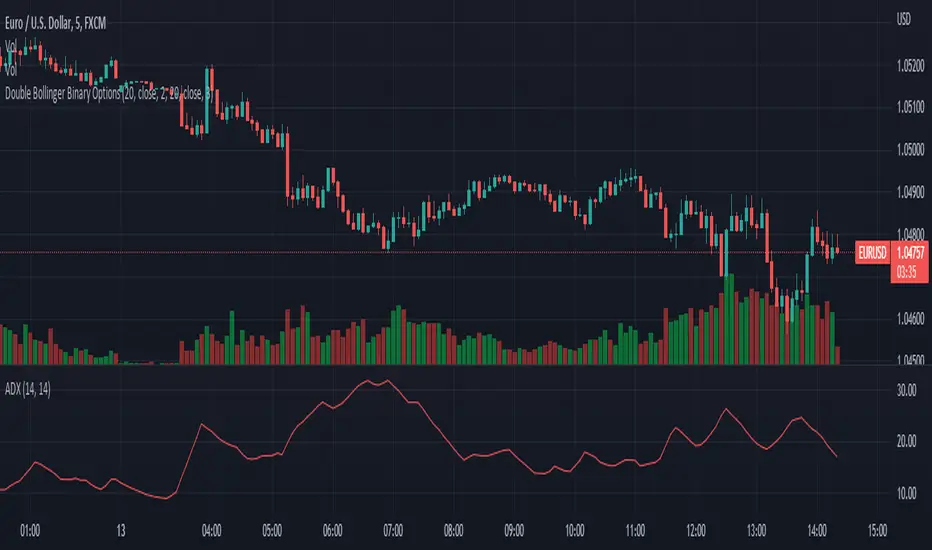
Double Bollinger Binary OptionsThis script uses 2 Bollinger bands and rsi oversold and overbought region to give signals. Basically, it detects those conditions where the market gets spiked in one direction aggressively(mostly during news) and then reverses back, although signals occur less frequently, this strategy is worth trying. Keep the timeframe for 5 minutes and trade for 5 candles i.e. 25 minutes :)